A1C vs. Average Glucose: What Your Lab Results Really Mean for Diabetes Management
Most people with diabetes know their A1C number. But how many truly understand what it means - or how it compares to the numbers they see on their glucose meter every day? If you’ve ever looked at your A1C result and thought, ‘But my daily readings are way lower than this,’ you’re not alone. The confusion between A1C and average glucose isn’t just common - it’s a major gap in diabetes education that can lead to poor decisions, missed hypoglycemia, and unnecessary stress.
What A1C Actually Measures
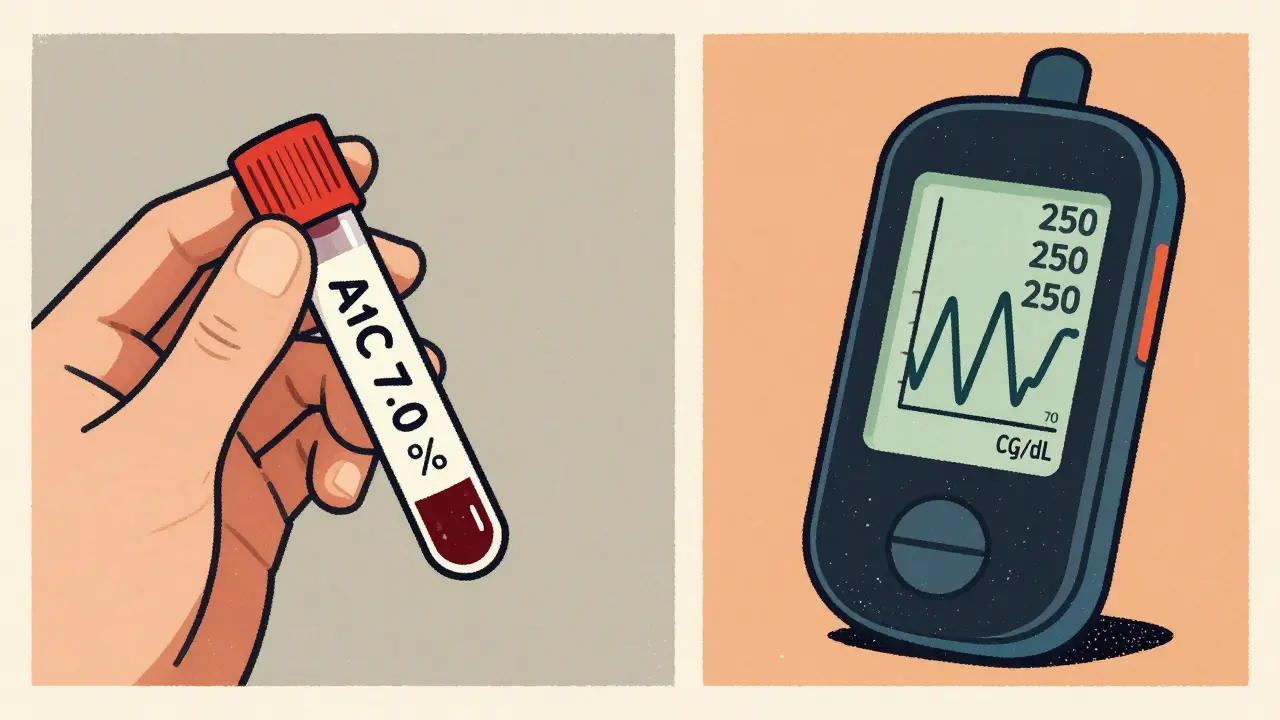
A1C, or HbA1c, is a blood test that shows your average blood sugar over the past 2 to 3 months. It works by measuring how much glucose has stuck to your red blood cells. Since red blood cells live for about 120 days, the test gives you a long-term snapshot - not a daily report.
Unlike fasting glucose tests, A1C doesn’t require you to skip breakfast or wait for a lab appointment. You can eat normally before the test. That’s one reason it’s become the go-to tool for doctors. But here’s the catch: A1C doesn’t tell you when your blood sugar spiked after lunch or crashed overnight. It just gives you a single number that averages everything out.
For example, an A1C of 7.0% means your average blood sugar over those months was around 154 mg/dL. That’s not a guess - it’s a math formula backed by decades of research. The American Diabetes Association uses this equation: 28.7 × A1C - 46.7 = eAG (estimated average glucose). So if your A1C is 8.0%, your average glucose is about 183 mg/dL. Simple. But misleading if you don’t know the full story.
What Average Glucose Really Is
When you check your blood sugar with a meter or a continuous glucose monitor (CGM), you’re seeing a moment-in-time reading. One reading tells you nothing. But if you collect hundreds of them - over days or weeks - you can calculate an average. That’s your average glucose.
There are two types of average glucose you’ll hear about: eAG and GMI. eAG is the calculated average from your A1C. GMI is the actual average from your CGM data. They use the same formula, but GMI comes from real-time data, not a lab test.
Let’s say your CGM shows you’ve been averaging 162 mg/dL over the last 30 days. Your GMI would be 7.3%. But your A1C test - done at the same time - might say 7.5%. That’s normal. The two numbers rarely match exactly because CGM measures glucose every 5 minutes, while A1C reflects what happened over 90 days, including periods you didn’t test.
Why A1C Can Be Deceiving
Here’s where things get tricky. A1C hides swings. You could spend 12 hours a day below 70 mg/dL and 10 hours above 250 mg/dL - and still have an A1C of 6.8%. Your doctor might say you’re doing great. But you’re having dangerous lows and scary highs. That’s glycemic variability, and A1C doesn’t capture it.
A 2021 study of over 5,700 people found that many with A1C under 7% were spending more than 8% of their day in hypoglycemia. That’s 2 hours a day with blood sugar too low. No one noticed because the A1C looked good.
People with type 1 diabetes are especially vulnerable to this blind spot. Their blood sugar swings faster and harder. A single A1C number can make them feel like they’re in control - when they’re actually dancing on the edge of danger.
And it’s not just about lows. Highs matter too. Research shows that post-meal spikes - even if they’re short - contribute to long-term damage. A1C doesn’t show those. Two-hour glucose tests after meals are better predictors of heart disease than A1C alone.
When Average Glucose Tells the Real Story
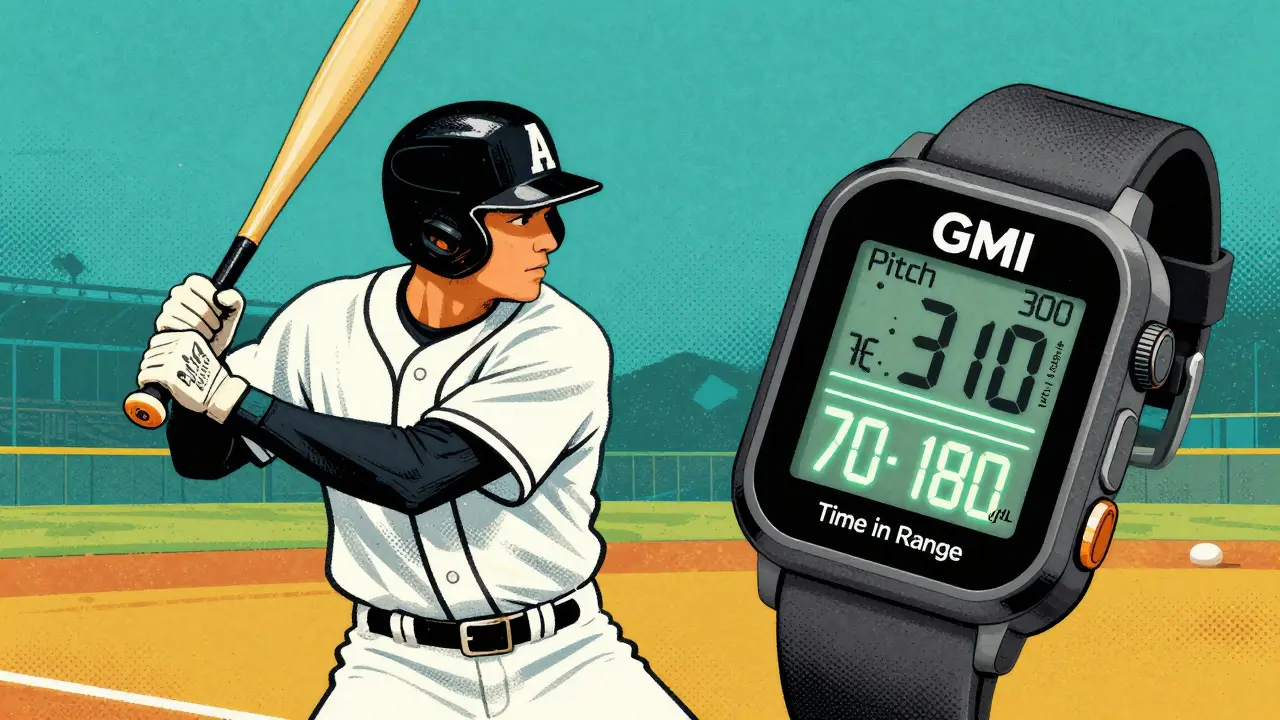
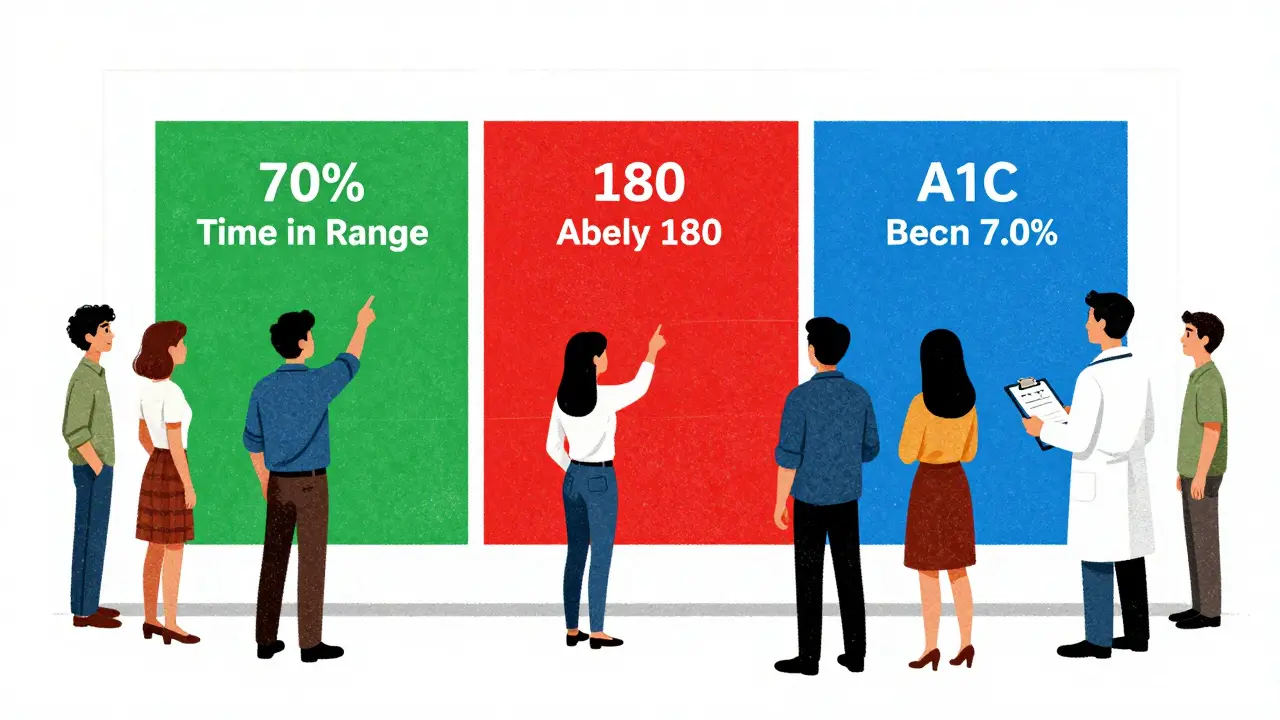
If you use a CGM, your GMI is your most honest reflection of daily control. It’s based on 1,000+ data points, not a single blood draw. That’s why experts like Dr. Richard Bergenstal say Time in Range (TIR) - how long you stay between 70 and 180 mg/dL - is now more important than A1C.
Here’s what good looks like with CGM data:
- Time in Range (70-180 mg/dL): 70% or more of the day
- Time below 70 mg/dL: Less than 4% of the day
- Time above 180 mg/dL: Less than 25% of the day
These numbers come from the Association of Diabetes Care & Education Specialists. They’re not just guidelines - they’re goals backed by evidence. And they’re impossible to see from A1C alone.
One user on a diabetes forum said: “My A1C was 6.8%, but my CGM showed I was below 70 for 8% of the time. My doctor didn’t even ask about my lows.” That’s not negligence - it’s a system built on outdated metrics.
How to Use Both Numbers Together
A1C and average glucose aren’t rivals. They’re teammates.
Think of A1C as your season batting average in baseball. It tells you how well you played overall. But if you want to win games, you need to know when you swung too late, missed the pitch, or got hit by a fastball. That’s where CGM and GMI come in.
Best practice? Get your A1C every 3 months - or every 6 months if you’re stable. But if you use a CGM, review your weekly and monthly reports. Look at your TIR, your lows, your highs. Don’t just look at the average.
Here’s a simple rule: If your GMI and A1C are more than 0.5% apart, something’s off. Maybe your red blood cells are turning over faster (due to anemia, pregnancy, or kidney disease). Or maybe your blood sugar swings wildly. Either way, it’s a red flag.
And if your A1C is 7.0% but your CGM shows you’re spending 30% of your day above 180 mg/dL? You’re not managing diabetes - you’re just avoiding a bad lab result.
What Your Target Should Be
The American Diabetes Association says most adults should aim for an A1C under 7.0%. But that’s not one-size-fits-all.
For a 25-year-old with type 1 diabetes and no other health issues, a target of 6.5% (eAG 140 mg/dL) is reasonable. For a 75-year-old with heart disease and frequent lows, 8.0% might be safer. Your goal should match your life - not a guideline on a poster.
The 2023 ADA/EASD consensus report calls this “glycemic individualization.” It’s a big shift. No more rigid targets. Instead, doctors are being told to ask: “What’s safe for you? What’s realistic? What keeps you alive and feeling well?”
And here’s something new: by 2027, Time in Range may replace A1C as the primary target in clinical trials. That’s how fast things are changing. A1C won’t disappear - but it won’t be the boss anymore.
What to Do Next
Here’s your action plan:
- If you don’t use a CGM, ask your doctor if it’s right for you. Even a 14-day sensor can show you patterns you’ve never seen.
- If you do use a CGM, stop fixating on your daily numbers. Look at your weekly and monthly reports. Focus on Time in Range.
- Compare your GMI (from CGM) with your A1C. If they’re more than 0.5% apart, talk to your provider.
- Ask your doctor: “What’s my Time in Range?” If they don’t know, find someone who does.
- Don’t let a single A1C number make you feel like a success or a failure. It’s one piece of a much bigger puzzle.
Diabetes isn’t about hitting a number. It’s about staying safe, feeling good, and living well. A1C is a tool. Average glucose is a tool. But your life? That’s the only thing that matters.
Is A1C more accurate than daily glucose readings?
A1C is more stable - it’s not affected by what you ate yesterday or how stressed you were. But it’s not more accurate. Daily readings show real-time changes, while A1C hides spikes and crashes. They measure different things. One isn’t better - you need both.
Why is my A1C higher than my CGM average?
Your CGM average might be based on 30 days, while A1C reflects 90 days. If you had high blood sugar 2 months ago but improved recently, your A1C will still be high. Also, CGMs can be slightly off - especially if not calibrated. A1C can also be skewed by anemia, kidney disease, or pregnancy.
Can I trust my A1C if I have anemia?
No. Anemia, iron deficiency, or other conditions that shorten red blood cell life can make A1C falsely low. If you have these conditions, your doctor should rely more on CGM data and GMI. Always tell your provider about any blood disorders.
What’s the difference between eAG and GMI?
eAG is a calculated estimate from your A1C. GMI is the actual average from your CGM data. They use the same formula, but GMI comes from real-time readings - often thousands per week. GMI is more accurate for tracking daily control.
Should I aim for an A1C below 6.5%?
Only if it’s safe for you. For many people, especially older adults or those with hypoglycemia unawareness, pushing below 7.0% increases risk more than it helps. The goal isn’t the lowest number - it’s the number that keeps you healthy and out of the hospital.
How often should I check my A1C?
Every 3 months if you’re changing treatment or not meeting targets. Every 6 months if you’re stable. But if you use a CGM, review your data weekly. Don’t wait three months to see if your habits are working.
Final Thought: It’s Not About the Number
The real problem isn’t that A1C is wrong. It’s that we treat it like the whole story. Diabetes isn’t a math problem. It’s a daily balancing act - between food, stress, sleep, movement, and insulin. No single number can capture that.
Use A1C as a checkpoint. Use average glucose as your daily compass. And always, always look at the full picture - the lows, the highs, the time in range. That’s where real control lives.


10 Comments
Gerald Tardif
December 26 2025Been using CGM for 18 months now. A1C was always 7.1, but my time in range was only 58%. Turned out I was crashing hard overnight-no symptoms, just fatigue. My doc didn’t even blink until I showed the graph. Now we tweak basals, not just meds. A1C’s a snapshot. CGM’s the movie.
Best decision I ever made.
Robyn Hays
December 26 2025It’s wild how we treat A1C like it’s gospel. I used to feel like a failure every time it crept up-until I started looking at my CGM trends. Turns out I was having 3am lows I never knew about. My A1C looked fine, but my body was screaming. We need to stop letting lab numbers silence real-life experience.
Diabetes isn’t a spreadsheet. It’s a living, breathing dance with your body. And you gotta listen to the music, not just count the beats.
Liz Tanner
December 28 2025I’m a nurse and I see this all the time. Patients get so hung up on A1C numbers, they ignore their actual symptoms. One lady had an A1C of 6.7 but was passing out at work. She thought she was ‘doing great.’ We had to explain that low blood sugar doesn’t care what the lab says.
Always pair A1C with CGM data. And if your doctor doesn’t ask about Time in Range? Find a new one.
Satyakki Bhattacharjee
December 28 2025They want you to believe A1C is science. But it’s just another way the medical industry keeps you dependent. Why do you think they don’t push CGMs for everyone? Because they make more money off blood draws and pills. The truth is hidden behind fancy numbers.
Wake up. Your body knows better than any machine or lab.
Anna Weitz
December 30 2025A1C is a lie designed to make you feel safe while your pancreas dies slowly
CGM shows the truth your doctor refuses to see
they want you docile not healthy
stop trusting the system
your lows matter more than your number
Jane Lucas
December 31 2025my a1c was 7.2 but my cgm showed i was under 70 for 10 hours a week and i had no clue
now i eat a snack before bed and dont feel like a zombie anymore
who knew
Elizabeth Alvarez
December 31 2025Have you ever wondered why A1C is still the gold standard when every single study shows CGM data is more predictive of complications? It’s not because it’s better-it’s because the pharmaceutical industry funds the guidelines. They profit off insulin adjustments based on A1C, not on real-time glucose patterns.
And don’t get me started on how they ignore glycemic variability entirely. That’s the real killer. The FDA knows this. The ADA knows this. But they keep pushing the same outdated metric because change costs money.
Meanwhile, people like me are dying from silent hypoglycemia because their doctor looked at a 7.0 and said ‘you’re doing great.’
It’s not negligence. It’s systemic betrayal. And they’re doing it to everyone.
They’re selling you a lie wrapped in a lab coat.
Miriam Piro
January 1 2026They told me my A1C was perfect at 6.8… but my CGM showed I was in hypoglycemia 9% of the time. I started blacking out at the gym. No one cared until I collapsed. Now I know why they don’t want you using CGMs-because then you’d realize how little they actually know.
And don’t even get me started on the ‘eAG’ formula. It’s based on data from the 1990s. We’ve had CGMs for 20 years. Why are we still using math from before smartphones?
It’s not a coincidence that the same companies that make insulin also make A1C test kits.
They’re not trying to help you. They’re trying to keep you hooked.
And the worst part? They’re making you feel guilty when you don’t hit their magic number.
It’s not diabetes that’s the disease-it’s the system.
😢
dean du plessis
January 2 2026Been in SA for 12 years and the diabetes care here is wild. Most folks don’t even have access to CGMs. A1C is all they got. But I tell my friends-don’t trust the number, trust how you feel. If you’re tired, dizzy, or crashing after meals? That’s your real A1C right there.
Don’t let a lab tell you you’re fine if your body says otherwise.
Kylie Robson
January 4 2026From a clinical perspective, the discrepancy between A1C and GMI is often attributable to erythrocyte turnover kinetics. Conditions like hemolytic anemia, recent transfusion, or iron deficiency can artifactually lower A1C independent of glycemia. Conversely, glycation rates vary by population-African ancestry individuals may have higher glycation efficiency, leading to elevated A1C despite lower mean glucose. This is why the ADA recommends GMI as a supplemental metric in high-risk cohorts. The eAG conversion is population-derived and assumes homogenous red cell lifespan, which is physiologically inaccurate. Therefore, integrating CGM-derived metrics into clinical decision-making isn’t just evidence-based-it’s biologically necessary. If your provider isn’t discussing TIR, GMI, and glycation variability, they’re practicing 1990s medicine.